

News
.jpg&w=3840&q=75)
Mobile Experiences Sharing on Jul
The technical sharing is coming back with some sharing sessions on mobile development “MOBILE EXPERIENCE SHARING: MEMORY MANAGEMENT”.
01 Aug 2018
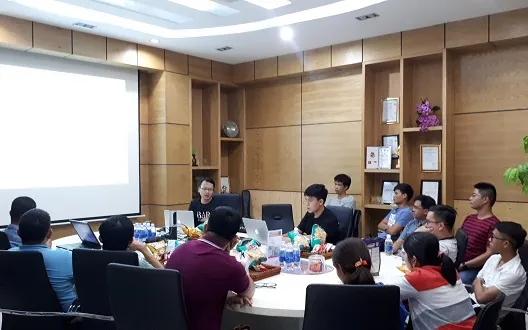
Introduction to Mobile Experience Sharing at S3Corp.
S3Corp. continues to foster technical learning by bringing back its internal technical sharing sessions. In July, the topic centered around a core aspect of mobile development: memory management. The session was part of the recurring series titled Mobile Experience Sharing, where experienced developers at S3Corp. discuss key challenges and solutions in mobile application development.
The July technical sharing was titled Mobile Experience Sharing: Memory Management, focusing on best practices and hands-on techniques that ensure efficient memory usage in both Android and iOS development environments. The session saw active engagement from participants, with developers showing strong interest in practical strategies to handle memory-related issues.
This technical exchange included three focused presentations delivered by Nam Tran, Vuong Tran, and Huy Truong. Each speaker shared specific insights based on their experience in Android and iOS development.
Android Best Practices in Memory Management
Presented by: Nam Tran, Technical Architect
Nam Tran opened the session by outlining critical best practices in Android memory management. He emphasized that poor memory handling often leads to application crashes, slow performance, and higher battery consumption. The talk began by identifying common memory problems such as memory leaks, inefficient data caching, and improper context usage.
Nam Tran explained that understanding Android’s memory model is essential. Android applications operate within a virtual machine, and memory is allocated in segments like the heap and stack. Developers must monitor the heap usage and be cautious about object references, especially in long-running services and background tasks.
He highlighted practical methods to reduce memory footprint. These included using appropriate data structures, releasing resources during activity lifecycle events, and limiting the scope of heavy object instances. A key point was the impact of context leaks, especially when anonymous classes or inner classes hold references to activities or views.
Nam Tran also stressed the role of tools like Android Profiler and LeakCanary. These tools help track memory usage in real-time and detect leaks before they become critical. Through real project examples, he demonstrated how improper use of static variables and handlers often leads to retained references, which prevent garbage collection.
The session closed with a discussion on optimizing bitmap usage. Loading high-resolution images without scaling can exhaust memory quickly. Developers should use methods like inSampleSize and opt for image loading libraries such as Glide or Picasso that manage memory efficiently.
Strong and Weak Variables in Objective-C
Presented by: Vuong Tran, Principal Developer
Vuong Tran took the stage to explain how Objective-C handles memory references. His topic focused on the use of strong and weak variables, which directly impact object lifecycle and memory deallocation in iOS applications.
The session began with a breakdown of Automatic Reference Counting (ARC), a memory management feature used in Objective-C. Vuong Tran explained that ARC keeps track of object references and automatically frees memory when no strong references remain.
He defined strong references as ownership-based references that increase the reference count of an object. Objects remain in memory as long as there is at least one strong reference pointing to them. This can easily lead to retain cycles, especially in delegate patterns or closures, where two objects hold strong references to each other, preventing deallocation.
To prevent retain cycles, Vuong Tran introduced the concept of weak references. These do not increase the reference count, allowing the referenced object to be deallocated if no other strong references exist. Developers should use weak references for delegates, self-referencing closures, and in parent-child object relationships where ownership should not be circular.
He gave detailed examples from real-world scenarios. One case showed a retain cycle created between a view controller and a block property that referenced self. Replacing the strong reference with a weak one resolved the issue. Another example showed how improper use of weak references can cause unexpected object deallocation if developers are unaware of ARC behavior.
Vuong Tran emphasized that proper understanding of reference types and object lifetimes is necessary to build stable and efficient iOS apps. This knowledge is critical when building reusable components, managing view hierarchies, and integrating third-party libraries.
Using Xcode Instruments for Memory Analysis
Presented by: Huy Truong, Senior Developer
Huy Truong concluded the session by introducing Xcode Instruments as a diagnostic tool for identifying memory problems in iOS apps. His session was hands-on, guiding the audience through the Instruments interface and showcasing how to use its features effectively.
He began by explaining the purpose of Instruments, a performance analysis toolset bundled with Xcode. It allows developers to monitor memory allocation, detect leaks, and observe app behavior in real-time. The focus of his talk was on the "Leaks" and "Allocations" tools within Instruments.
During the live demonstration, Huy Truong launched a sample app and connected it to Instruments. He showed how to trace object lifecycles and inspect memory growth. The "Allocations" instrument was used to pinpoint objects that were not released correctly. This included checking the retain count and reference graph to identify what is holding onto the memory.
The "Leaks" instrument was used to discover memory leaks by scanning heap allocations. Once a leak was detected, he traced it back to its source by analyzing the call stack and responsible allocation. He discussed how developers can interpret these results to resolve the root cause in the source code.
He also demonstrated how to use memory snapshots to compare before-and-after states of the memory during specific user interactions. This helps in identifying which operations are causing excessive memory usage or unexpected object retention.
The session wrapped with best practices when using Instruments. Developers should always test under real usage conditions, repeat key workflows, and perform multiple profiling runs to ensure consistent results. Huy Truong stressed that memory profiling should be part of regular development cycles, not just reserved for debugging.
Event Summary and Acknowledgment
The training session generated strong interest from the S3Corp. developer. Attendees appreciated the clarity of the presentations and the relevance of the topics covered. Each speaker focused on practical and actionable knowledge, equipping developers with tools and insights to manage memory more effectively in their mobile projects.
S3Corp. extends sincere thanks to Nam Tran, Vuong Tran, and Huy Truong for delivering in-depth and engaging presentations. Their expertise and willingness to share knowledge continue to contribute to the technical growth of the company’s mobile development teams.


_1746790970871.webp&w=384&q=75)


